Analytics tell you how people move through your form, from the moment they open it to the moment they submit. Picture Rina, who shares a lipstick variant test with her Instagram followers and her TikTok Shop buyers. She wants to know which channel actually brings people in, and if many of them leave halfway, which question made them leave. With that answer she can shorten the form before she spends the next round of followers on it.
You'll find everything in the Analytics tab of your form overview, and everyone with access to the form can view it.
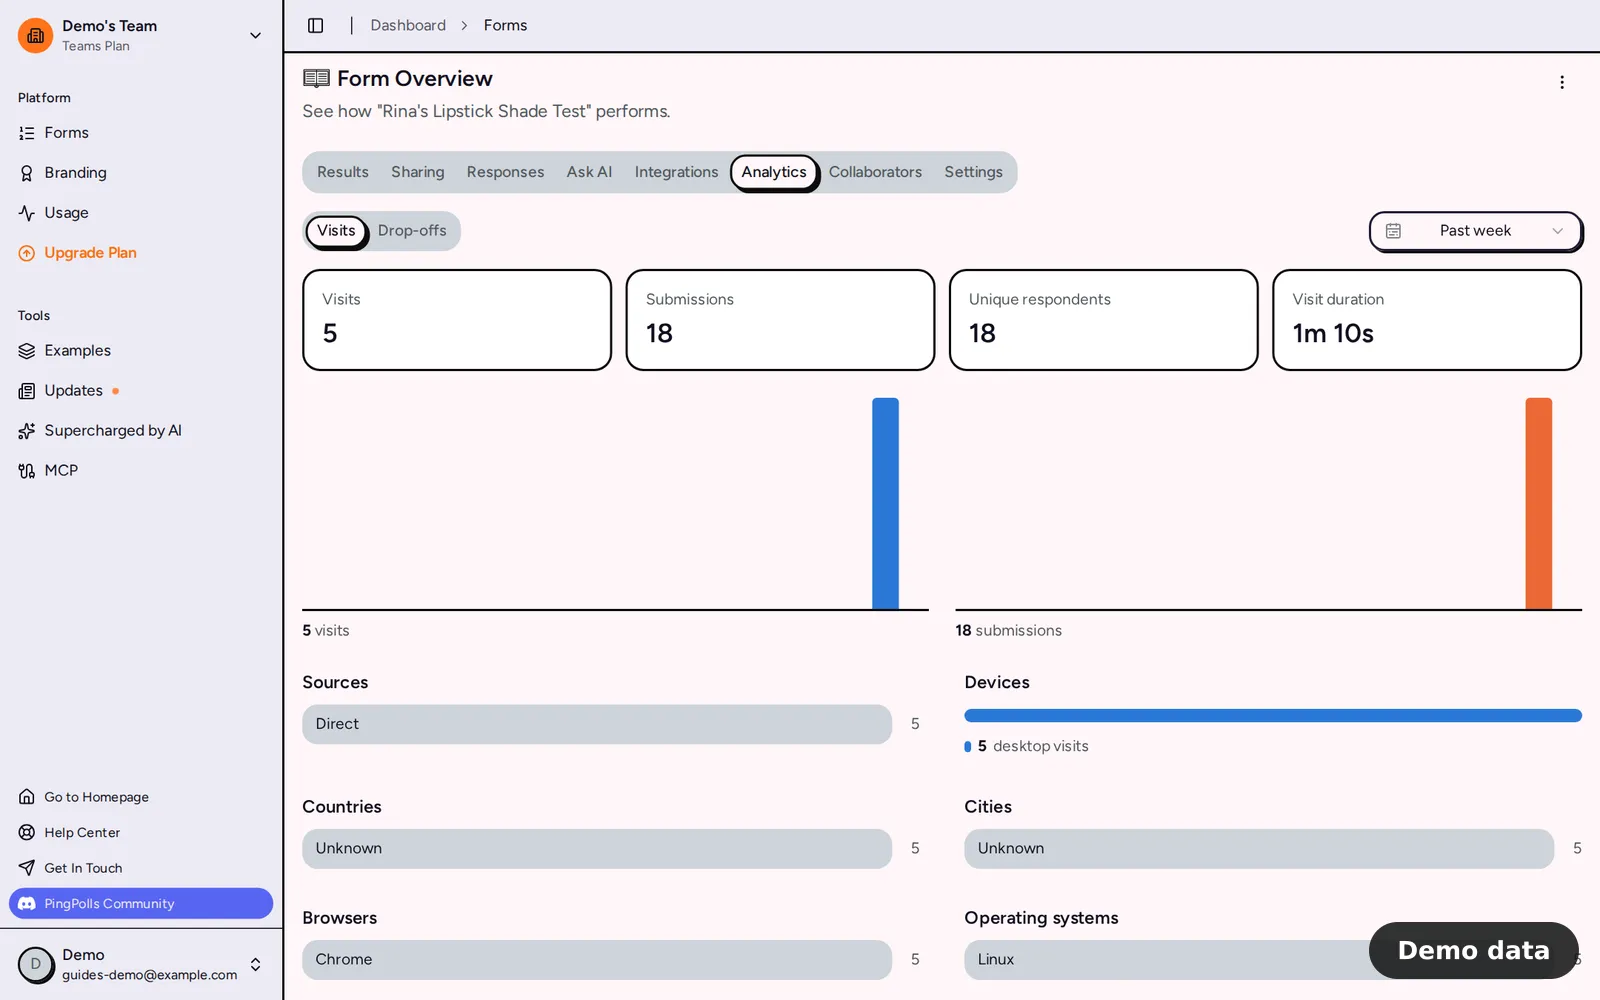
How to read your form analytics
- Open your form from Forms and go to the Analytics tab.
- Pick a date range. On Free you can choose the last 24 hours, today, yesterday or the past 7 days, which is the default. Paid plans add 30 days, 90 days, 6 months, 1 year and all time.
- Stay on Visits to see the summary tiles, a chart of views and submissions over time, and the top breakdowns.
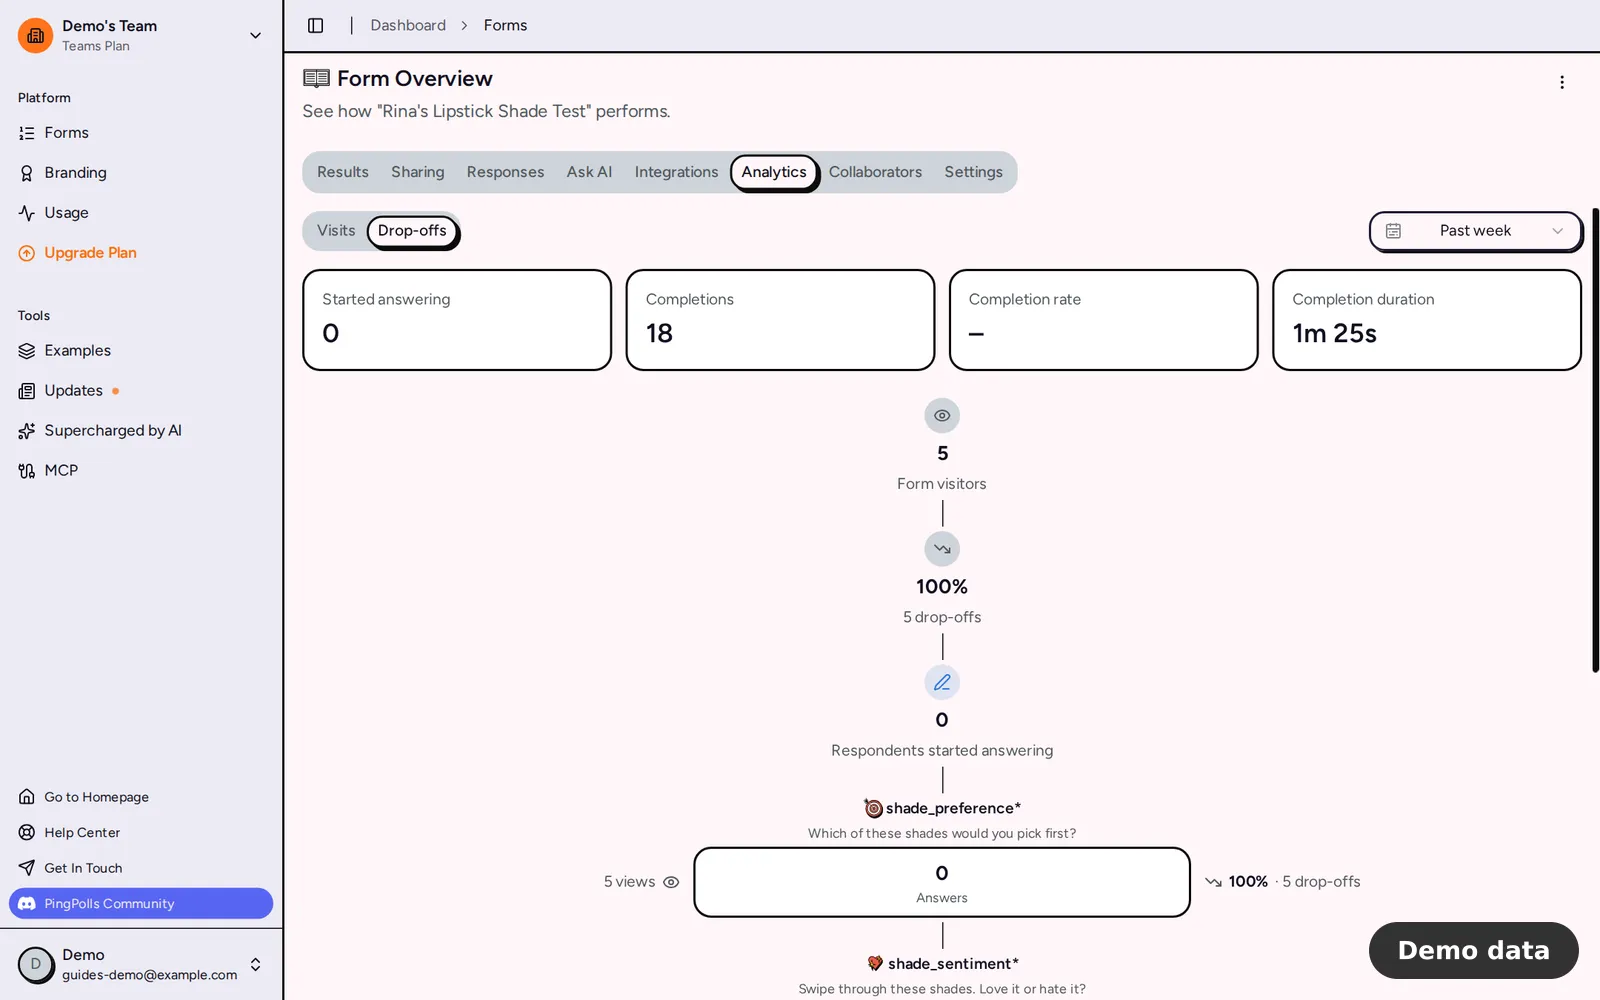
- Switch to Drop-offs to see the funnel question by question (Pro and Teams).
The date range you pick is remembered on your account and shared with the Results and Responses tabs, so all three stay in step.
What the Visits view shows
These numbers are available on every plan.
- Visits counts every time the form page starts, so a reload counts again.
- Unique respondents counts the different people with finished responses in the range.
- Submissions and Visit duration show how many finished and how long a visit lasted on average.
- Breakdowns list the top 6 sources, countries, cities, browsers and operating systems, and the top 3 devices.
The source comes from the utm_source value in the link, then from the site that sent the visitor, and otherwise reads "Direct". That's how Rina tells her channels apart. She shares one link with ?utm_source=instagram in her bio and another with ?utm_source=tiktok in her shop chat, and the Sources list shows each one separately.
What the Drop-offs view shows
On Pro and Teams, the funnel starts with Form visitors, shows how many dropped off before answering, then how many Respondents started answering. Below that, each question shows how many people reached it, how many answered, and the share who left there. Tiles on top show Started answering, Completions, Completion rate (submissions divided by starts) and Completion duration.
For Rina, a question with a big drop-off share is a clear signal. If many people leave at "Upload a photo of your lips", she can make it optional or move it to the end, then compare the next week's funnel.
On Free, the Drop-offs view shows "Ready to optimize your form?" with an Upgrade plan button.
How the numbers are collected
The respondent's browser reports visits, starts, answered and skipped questions and when someone leaves, in small batches. Active time only counts while the form's tab is visible, and each question is counted at most once per visit. Preview runs in the studio aren't recorded, and a closed form records nothing.
We keep raw events for 30 days and strip session, response and IP identifiers from them after 7 days. Hourly counts, which hold no identifiers, are kept for the life of the form. When you delete a response, its events go too and the counts update at once.
Frequently asked questions
Why is Visits higher than Unique respondents?
Visits counts every page start, including reloads and people who never submit, while Unique respondents only counts people with finished responses.
Can I see the questions people answered, not just the counts?
Yes, in the Results and Responses tabs. See view and export responses, or ask questions in plain words with Ask AI.
Does tracking work for embedded forms and QR codes?
Yes, every channel is counted. A scan of a QR code has no referring site, so it shows as "Direct". To send visits to Meta or Google Analytics as well, see Meta Pixel and Google Analytics.
