When the fieldwork ends, your responses need to leave PingPolls in a shape someone else can trust. Elena, a researcher at an agency, delivers each study as a spreadsheet her client's analysts open in their own tools. She wants readable answers rather than codes, one column per question and nothing that breaks when the file is opened, so she can spend her time on the findings instead of fixing the file.
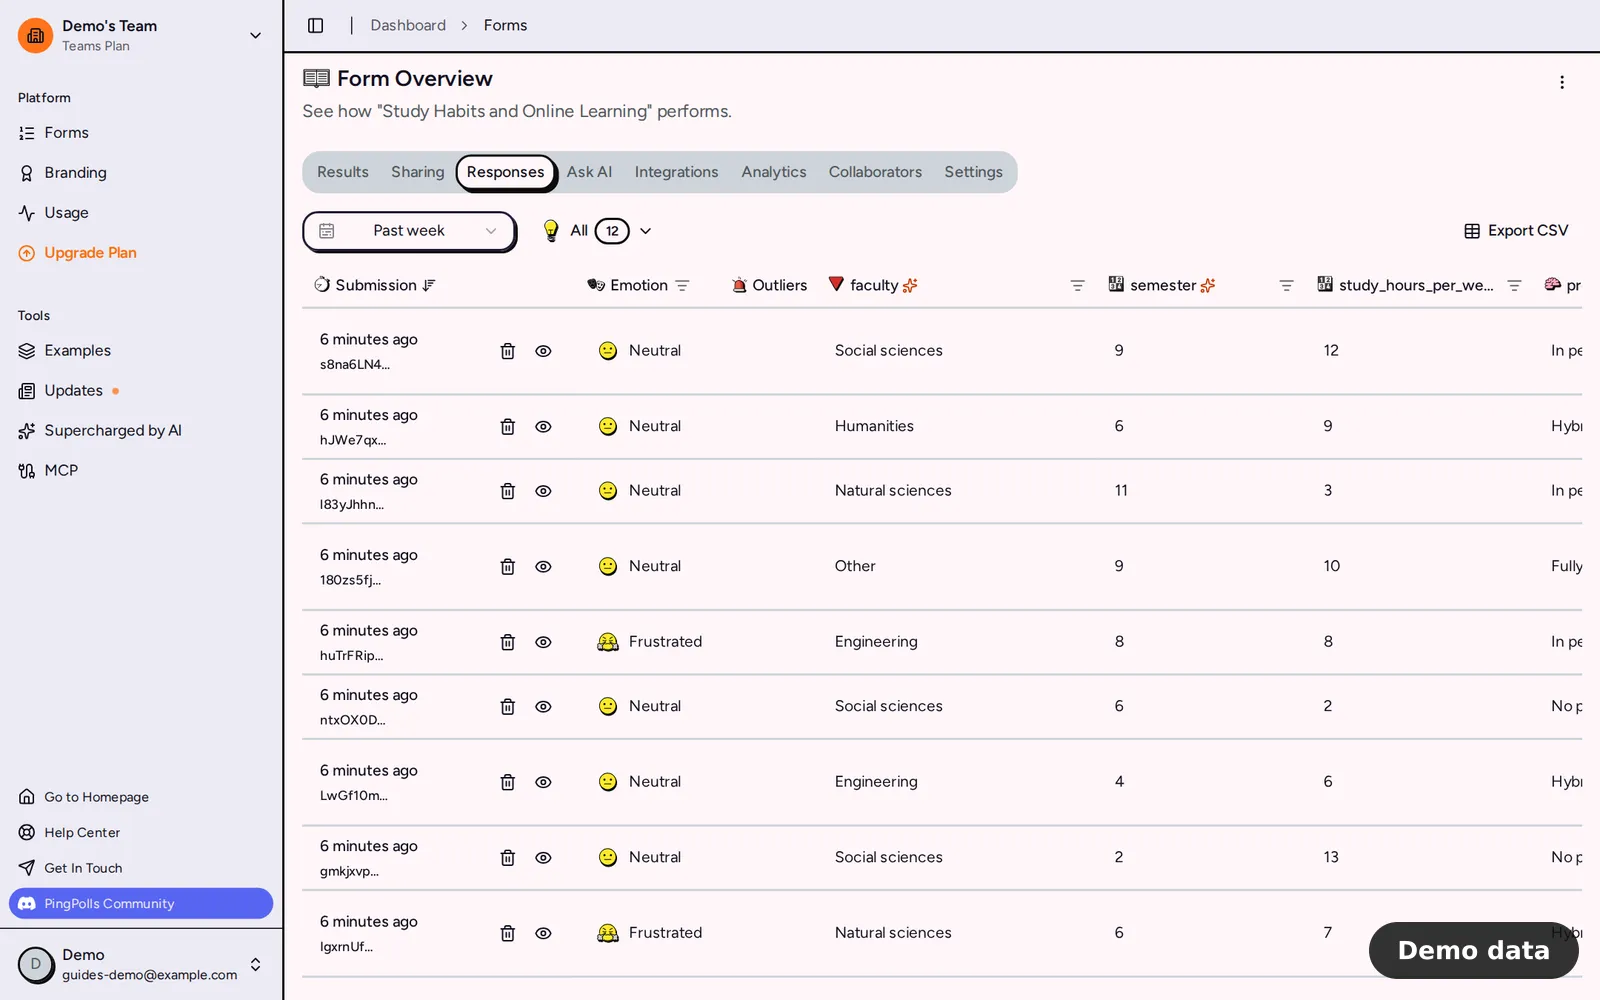
PingPolls shows your data in two tabs of the form overview. Results summarizes each question with charts and tables, and Responses lists every response with one column per question, which is also where you export.
How to view responses
- Open your form from Forms. It opens on the Results tab, with the summary tiles, the Emotion Analysis card and a section for each question.
- Pick a date range at the top. It's remembered on your account and shared with the Responses and Analytics tabs.
- Switch to the Responses tab to see a table of responses, newest first. Click the Submission header to flip the order.
- Use the Status dropdown to show all, completed, partial or processing responses.
- Click View on a row to open the response. The viewer has three tabs, Answers, History (the conversation as the respondent saw it) and Result (the result page they were shown).
The table loads 10 rows at a time as you scroll and shows up to the first 100 matching responses. When more match, a note tells you how many, so narrow the range or filters, or export the CSV, which has no row limit.
How to filter responses
Click the funnel icon in a column header to filter that column.
- Choice, sentiment and preference columns use checkboxes, for example "Responses that picked any of these".
- Short text, email, link, number, date and phone columns match an exact value, ignoring case.
- The Emotion column filters by the emotion found in each response.
Values within one column combine with OR, and different columns combine with AND, so you can ask for "Segment A or B, who picked Concept 2". You can filter up to 20 columns with 30 values each. Long text and file questions can't be filtered. Click Clear filters to start over.
How to export responses to CSV
- On the Responses tab, set the date range and filters you want, because the export follows them.
- Click Export CSV. It opens a signed download link in a new tab.
- Open the file in your spreadsheet tool.
The download link works for 24 hours. Only the form owner (or team owner) sees the Export CSV button.
What's in the CSV
The file has a response ID column, one column per question and then one per custom field. Answers are written as readable text from the version of the form each person answered.
- Choices show their labels, with checkbox and multi-select answers joined by commas and typed "Other" text included.
- Phone numbers are in international format.
- Preference ranking and sentiment cards show
label: scorelines. - Files are PingPolls links that check access before opening.
- Numbers stay numbers.
Cells that start with =, +, - or @ get a leading ', so spreadsheets don't run them as formulas. Timestamps, status, emotion and outliers aren't in the CSV today, so use the Responses tab when you need those.
Delete a response
The form owner can delete a response with the trash button on its row. That removes its files, its analytics events and its share of the results, and lets the same person answer again if a duplicate check would have stopped them.
Frequently asked questions
Can collaborators export?
Collaborators can view, filter and open responses, but only the form owner or team owner can export or delete.
Can I send responses to a spreadsheet automatically?
Yes. Connect Google Sheets or send each response to your own system with webhooks.
Can I ask questions about the data instead of exporting it?
Yes. Ask AI counts choices, finds respondents and groups open answers into themes, and it can hand you a CSV of the respondents it found.
